Failure Handling
Failure handling has two layers and one authority:
- The wrapper decides whether a failure is permanent (exit 13) or transient (exit 1). It also reports a kill (exit 143), including the one the kubelet sends when the pod's wall-clock budget runs out.
- The Indexed Job carries that verdict for each index and absorbs disruptions. Retries, retry budgets and progress belong to Kubernetes, not to anything htrflow-batch runs.
manifest.jsonin S3 is the authority. It is the only thing that ever means "done".
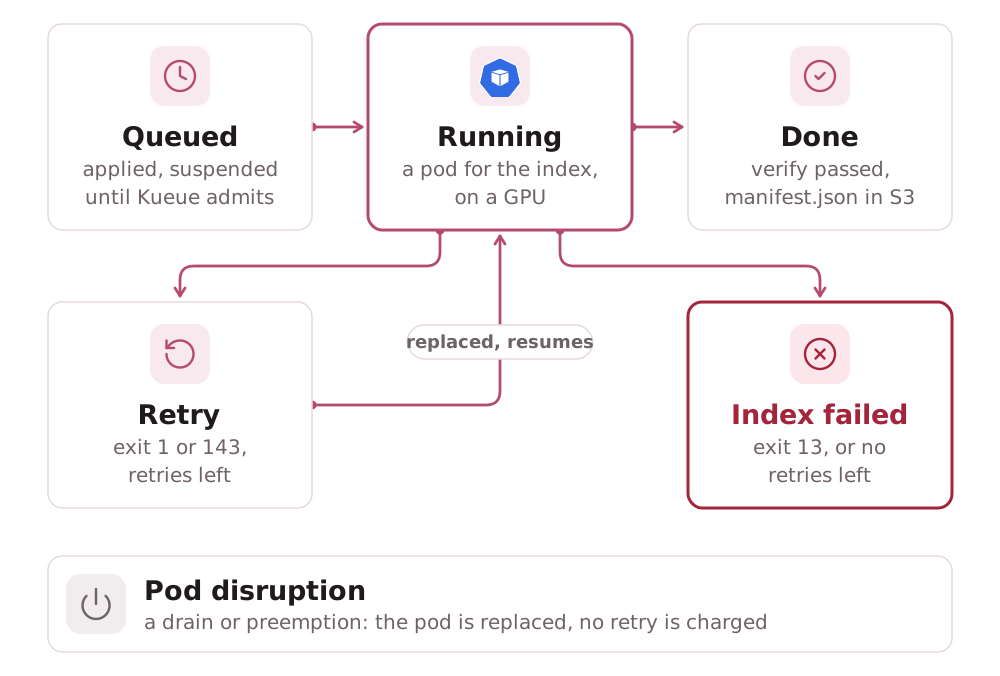
A failed_index appears in the Job's failedIndexes field and as
state: "failed" on the read API's volume row. The wrapper's termination
message appears as the row's reason for as long as the pod that produced it
still exists.
A retried index stays inside the admitted Job, so it does not go back through Kueue (Queueing).
Invariants
- Done means verified means
manifest.jsonexists (per pipeline id). An exit code alone is never trusted: the wrapper keeps each page's outcome, listspage/andalto/after the loop, and publishes the marker only when every page is accounted for. - Retries converge. A resumed run skips pages that already have both
files and were made from the source image the page has now (per the
source-digesteach page's ALTO carries). Every other page loses its stored files before it is redone. A retry of a long volume costs minutes, not hours, and a source that changed does not reset the attempts that follow it. - A page that cannot be fetched or transcribed is recorded, not hidden.
The volume completes, and that page appears as
failedinmanifest.json, is counted inpages_failed, and is named on the campaign page. A page that fails deterministically fails the same way on every retry. Failing the whole volume for it would leave the bucket with the good pages and no marker to open them. - Two cases still fail the volume. A page missing from the results (neither uploaded nor recorded as failed, usually a download or upload deferred to the next attempt), and a run where every processed page failed and nothing was resumed. Both are transient and report their page lists in the termination message.
- The last attempt does not defer. A page still deferred on the index's
last attempt is recorded as failed instead, with
(still failing on the index's last attempt), so one page the source never serves cannot cost the others their completion marker. - A campaign is append-only.
completionsis fixed at creation from the volume list, and a new campaign file is the only way to add volumes (Campaign & Pipeline YAML).
The Job contract
render._campaign_job renders the Job. The fields that decide what a
failure costs are below; the full rendered object is in
Rendered objects.
| Field | Value | Why |
|---|---|---|
backoffLimitPerIndex |
3 |
The per-index retry budget, kept by Kubernetes, so there is nothing to reconcile |
maxFailedIndexes |
equal to completions |
A campaign never stops early because of failures. Every index gets its own verdict |
podFailurePolicy |
Ignore on DisruptionTarget, then FailIndex on exit 13 from wrapper or warmup-wait |
A drain, preemption or eviction replaces the pod without charging a retry. Exit 143 matches no rule, so it is retried like exit 1 |
terminationGracePeriodSeconds |
120 |
Covers the wrapper's SIGTERM path |
Why the grace period is 120 s. On SIGTERM the wrapper writes its termination message and ships the run log one last time inside a 90 s budget (the log client: 5 s connect, 15 s read, two attempts). An upload still going at 90 s is abandoned, so the SIGKILL at 120 s never arrives first. Kubernetes' default of 30 s would kill the pod mid-cleanup on a merely slow endpoint.
The per-volume time limit is the pod's deadline,
spec.template.spec.activeDeadlineSeconds, not the Job's. It is rendered from
the pipeline's own max_seconds, or from converter.yaml's (default 21600 s,
6 h). A Job-level deadline would kill the whole campaign. A pod-level one
kills exactly the attempt that overran. At the deadline:
- The kubelet SIGTERMs the container.
- The wrapper writes its message and exits 143.
- The kubelet marks the pod
status.reason: DeadlineExceeded, without aDisruptionTargetcondition.
The Ignore rule therefore does not swallow it. The attempt is counted, and
backoffLimitPerIndex retries the index.
Resources, mounts and pod hardening are in Rendered objects and Security.
Exit codes and what each one costs
| Wrapper exit | Written to /dev/termination-log |
Index outcome |
|---|---|---|
0 |
— | Complete, shown in completedIndexes, once manifest.json exists. A volume that lost pages still exits 0: they are recorded, and pages_failed says how many |
13 permanent |
{"stage", "permanent": true, "error"} |
FailIndex: in failedIndexes, never retried |
1 transient |
{"stage", "permanent": false, "error"} |
Retried up to backoffLimitPerIndex (3), resuming from published pages. At the cap, in failedIndexes |
143 SIGTERM (a drain that reached the container, or the pod deadline) |
{"stage", "permanent": false, "error": "SIGTERM"}, then the final log ship |
Retried the same as exit 1. Progress already published is not redone |
| none (pod disrupted before or while running) | — | Pod replaced (Ignore), no retry charged |
Permanent, per the wrapper:
- config errors, such as a missing environment variable
- a manifest URL that is not http(s)
- a 400, 401, 403, 404 or 410 on the manifest
- a manifest body over
MANIFEST_MAX_BYTES, non-JSON, with no canvases, or with a canvas that has no image - bad pipeline YAML, an unknown step or model class, or a setting a step does not take
Transient:
- a 5xx, a 429, a network error or the download deadline on the manifest
- a page missing at verify, including a page whose download was deferred
- a run where every processed page failed and nothing was resumed
- a model-load
OSError, including a model missing from the read-only cache - five consecutive upload failures (
UploadOutage); a single failed upload only defers its page. Each has already been retried by the S3 client (10 s to connect, 60 s to read, three retries), so five in a row is an outage rather than a bad page - three consecutive pipeline rebuild failures after a dead worker thread: a rebuild reloads the models from the cache, so one failure may be a passing error, and three in a row are not
- eight or more htrflow threads left running by pipelines the wrapper had to give up on (see below)
The full table is in the Wrapper reference.
A dead htrflow worker thread
htrflow's Inference steps hand each batch to a daemon thread and wait on a
Future. An exception inside that thread kills it, and pipeline.run then
waits for ever. One known trigger is a YOLO mask too small to become a
polygon (TypeError: 'NoneType' object is not iterable). Unguarded, the pod
would hold its GPU until the pod deadline, then retry onto the same page.
So driver runs each page's pipeline.run in a helper thread and checks
every step's worker threads once a second (THREAD_POLL_SECONDS). A dead
thread, or a page with no progress for PAGE_TIMEOUT_SECONDS (default 600 s,
a window without progress, not a total), raises PipelineDead, a page
failure:
WARNING page 0044 failed: PipelineDead("page 0044: htrflow's Segmentation (model Riksarkivet/yolov9-regions-1) worker thread died; the page is marked failed and the pipeline is rebuilt")
WARNING rebuilding the htrflow pipeline after a dead worker thread
The dead pipeline's models are released and the CUDA cache emptied
(driver.release_pipeline), a fresh pipeline loads from the cache PVC, and
the volume completes with that page recorded as failed. It is not exit 1:
the cause is in the image, so every attempt would die the same way. A thread
stuck inside a model call cannot be stopped and may still hold weights, so at
eight such threads (about four hung pages) the run stops as transient and the
retry gets a fresh pod.
What a person is told
Exit codes, the termination JSON and the permanent failure in <stage>:
prefix are for machines. Every surface that talks to people says instead,
in plain sentences, what happened, where, and what to do next, and each
translates in one place:
| Surface | Where the sentence is written |
|---|---|
| Campaign page | frontend/src/lib/reasons.ts (describeReason, describeApiError), pinned in reasons.test.ts |
| Run log | packages/wrapper/src/htrflow_batch/main.py: _advice, appended after the prefix |
| Converter CLI | parse.py and the models' validators (Campaign & Pipeline YAML) |
What each failed-volume sentence on the card means, and what the operator does about it, is in Troubleshooting. The page-level errors and stage names the card shows are in Web front & read API.
Evidence that survives the Job
Everything an operator needs is in the bucket well before the Job's
ttlSecondsAfterFinished reaps it:
| Key | Written when | Content |
|---|---|---|
<namespace>/status/logs/<pipeline>/<volume>.txt |
While the volume runs, every 15 s, and once on exit (also on SIGTERM) | The wrapper's own stdout and stderr: the complete log (The run log) |
<pipeline>/<volume>/progress.json |
After every page outcome and at every stage change, except in the config stage (see below) |
The last stage reached, page counts and the most recent page failure |
A run that fails in the config stage writes no progress.json: until the
settings parse there is nowhere to write it. Its evidence is the termination
message and the pod's log. The read API shows a termination message as
reason only while the pod exists; after that the run log is what remains.
When a pod's status.reason is DeadlineExceeded and its error is
"SIGTERM", the API shows "error": "DeadlineExceeded", since only the pod
can tell a deadline kill from a drain.
Retries, natively
There is no retry budget file and nothing to clear by hand.
backoffLimitPerIndex and maxFailedIndexes are read straight off the Job.
A failed index is never re-run in place: the volume goes into a new
campaign. On the same pipeline id, apply holds that campaign back while
the old one still runs, since both would write the same results; under a new
pipeline id it starts at once
(Troubleshooting).
Warm-ups fail the same way
A pipeline's htr-warmup-<id> Job fails independently of any campaign. It
has backoffLimit: 2, a 1 h pod deadline, and a podFailurePolicy of the
same shape on its warmup container. Exit 13 there is FailJob.
- The deadline is the pod's, not the Job's, so a kill keeps its
termination message and counts against
backoffLimit: a warm-up that ran out of time on a slow first download is retried. - There is no warm-up log. The pod mounts no S3 Secret. Its termination
message (
{stage: "warmup", permanent, error}) is shown on the campaign card's warm-up chip (Web front & read API), and a kill leaveserror: "SIGTERM"there rather than nothing. - A transient failure (a network or disk error) is retried up to
backoffLimit. - A permanent failure is exit 13: a bad model id or revision, an unknown step, a setting a step does not take, invalid YAML, or a marker that could not be written.
- Recovery is a re-apply. The next
applydeletes and recreates a failed warm-up, so fixing the cause (a missing Secret, a Hub outage) and re-applying is the whole recovery. - The marker is written before the success log line, and failing to write it is fatal, so a green warm-up always left a marker.
The campaign side is bounded. Every batch pod waits for the marker in its
warmup-wait init container, which gives up after converter.yaml's
warmup_wait_seconds (default 900), prints one line naming the marker, and
exits 13. The podFailurePolicy turns that into FailIndex, and
terminationMessagePolicy: FallbackToLogsOnError makes the line the row's
reason. The wait is bounded because a batch pod holds its GPU and Kueue's
quota through its init containers.
Only a completed warm-up whose marker is gone (a replaced or wiped cache PVC) needs a manual step: delete the Job, and the next apply runs it again. How to find out why a marker is missing is in Troubleshooting.