Events and signals
Almost nothing in this system publishes a campaign status document. Nearly
every question is answered from a signal something else already emits:
Kubernetes' own bookkeeping while the Job exists, and objects in the bucket
after it is gone. There are two exceptions. How far a running pod has got
is answered by the wrapper itself, in progress.json beside the volume's
results, which the read API fetches through the results proxy, with the caller's
session (View results).
How a campaign ended is kept in one small ConfigMap,
campaign-<name>-status, written by the read API and by apply
(The record a campaign leaves).
This page lists every signal and who reads it.
One index, in order
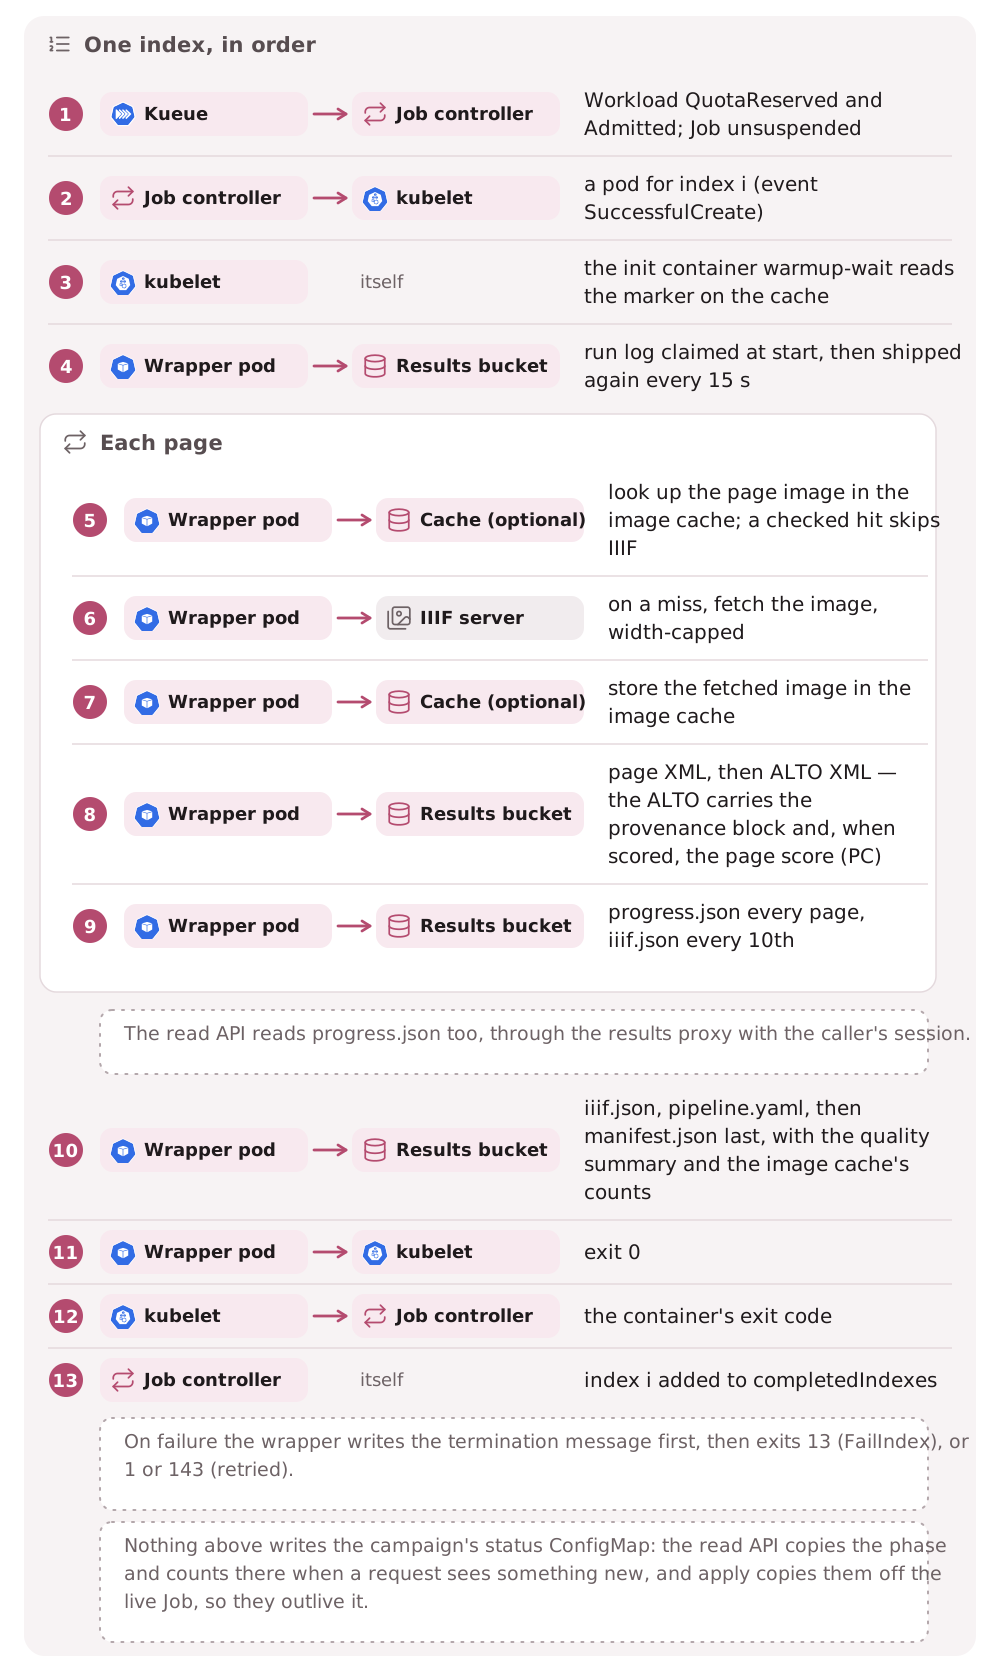
The signals
| Signal | Produced by | Read by | Survives the Job's TTL |
|---|---|---|---|
Job condition Suspended (reason JobResumed when it clears) |
Kueue's webhook, then the Job controller | Status page (Queued/Paused), operator |
no |
Job conditions SuccessCriteriaMet then Complete, FailureTarget then Failed |
Job controller | Status page phase, operator | no |
status.completedIndexes/failedIndexes (range strings, e.g. 0-2,5) |
Job controller | Status page per-volume state, operator | no |
Pod phase and status.reason (DeadlineExceeded after the pod's own deadline) |
kubelet | Status page, which shows the wrapper's SIGTERM as DeadlineExceeded when the pod's status.reason says so |
no |
| Container exit code: 0, 13, 1, 143 | wrapper, via the kubelet | podFailurePolicy (13 becomes FailIndex), operator |
no |
wrapper termination message, {"stage", "permanent", "error"} (policy File) |
wrapper | Status page reason, operator |
no, and only while the pod itself exists |
warmup-wait termination message: one sentence naming the marker (policy FallbackToLogsOnError) |
the init gate | Status page. The volume's reason falls through to a non-zero init container |
no |
Warm-up Job's {"stage": "warmup", …} message |
htrflow_batch.warmup |
The campaign card's warm-up chip | Warm-up Jobs have no TTL. A pruning apply removes a warm-up Job once its pipeline file is gone |
Workload conditions QuotaReserved, Admitted, Finished, Evicted |
Kueue | operator (Troubleshooting) | no. The Workload is owned by the Job |
Events: Suspended, Resumed, SuccessfulCreate, Killing, FailedIndexes |
Kueue, Job controller, kubelet | operator (kubectl get events) |
no, and the API server drops them after its event TTL (an hour by default) |
Warm-up marker /data/warmup/<pipeline-id>.done, in the recipe's own directory of the cache (<pipeline-id>-<recipe sha256>/ on the volume) |
The warm-up Job, before it logs success | Every batch pod's init container of the same recipe | yes, it lives on the cache PVC |
Run log <namespace>/status/logs/<pipeline>/<volume>.txt |
wrapper, every 15 s and once on every exit path | Run viewer, operator (below) | yes |
page/NNNN.xml and alto/NNNN.xml |
wrapper uploader, PAGE first, each with the source-digest of its image as object metadata |
Resume (both must exist, and the ALTO's digest must match the page's source now), verify, the viewer | yes |
progress.json |
wrapper, after every page outcome and at every stage change, and with stage failed on any exit that is not a success |
The read API, and so the campaign page's page counts and its failure notice. It caches each: 5 s for a running volume, an hour once it is over | yes |
iiif.json, pipeline.yaml |
Publish, after verify. iiif.json covers the pages that came out, so a volume with a failed page is one canvas short. iiif.json is also written every 10 pages during the run, covering the pages done so far |
The Universal Viewer, and a person reading the recipe back | yes |
manifest.json |
Publish, last | Anyone asking "is it done?". pages_ok/pages_failed say whether the volume lost pages on the way. Resume falls back to its page_source_digests for a page stored without a source-digest, and its timings (gpu_stall_seconds, wall_seconds) are the evidence for or against a cache layer |
yes |
ALTO Processing ID="htrflow-batch" block |
provenance.stamp_alto, before the upload |
Anyone holding the file, with no cluster at all | yes |
ConfigMap campaign-<name>-status: phase, the three volume counts, startedAt, finishedAt, resultsBase, jobUid, and failedVolumes from the detail route |
The read API on every request that sees something new; apply, from the live Job |
The campaign browser once the Job is gone, and apply, to leave a finished unchanged campaign alone |
yes, it has no TTL of its own. It is a cluster object, not a bucket one |
The pattern is the same everywhere: everything Kubernetes emits is evidence
for as long as the Job lives, and everything in the bucket is evidence for
good. The status ConfigMap is the one deliberate exception, and it carries a
summary rather than the per-index detail. That is why manifest.json, not an
exit code or a Job condition, is the only thing that means "done".
The commands that answer the everyday questions (what is running, how far a campaign has got, why an index failed, whether a volume is finished) are in Troubleshooting.
Progress staleness
progress.json is the one signal here that a reader may find stale
rather than missing:
- It is written best-effort. A failed write is logged and dropped, so a page never loses its work to a status file.
- It is read best-effort. A bucket that does not answer means no progress on the page, never an error.
- Its age is shown with it. "Updated 12 s ago" is the difference between
a volume that is working and one that has stopped. The API computes
ageSecondsfrom its own clock, so a reader's skewed clock cannot distort it. - It never means "done". Only
manifest.json, written last, does.
The run log
The campaign browser follows a running volume without anything writing a status document for it. The pod ships its own log to S3. The browser reads the log through the results proxy, with the logged-in person's own store keys, and asks the read API, the only component with cluster credentials, which volumes exist and what state they are in.
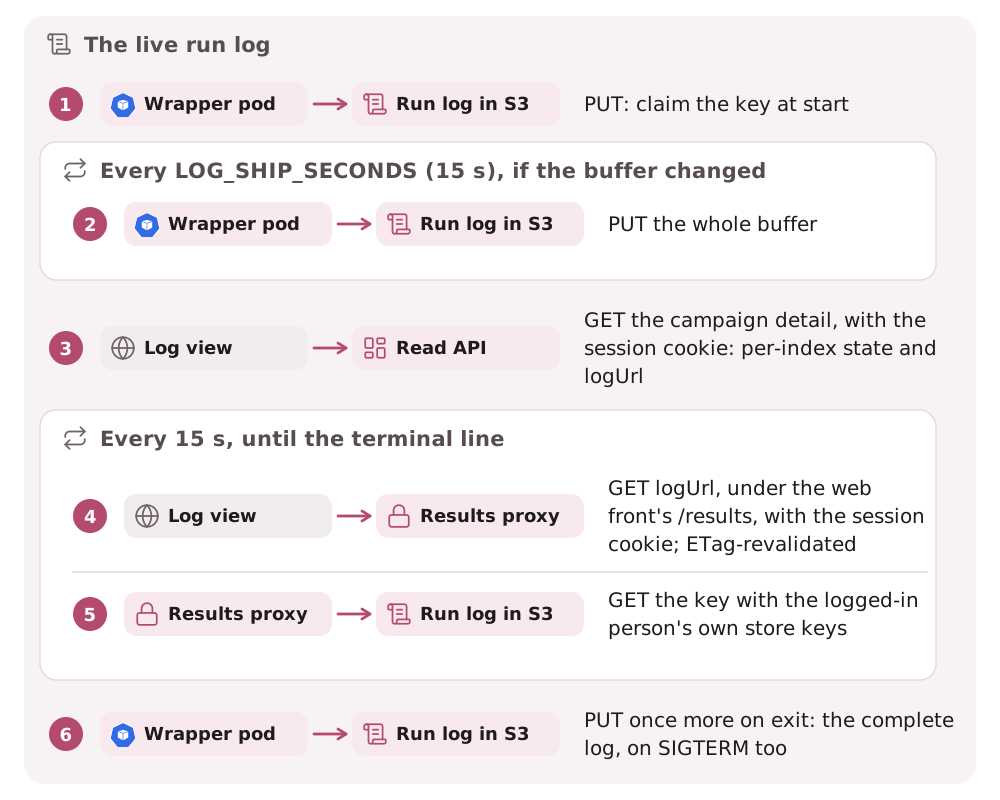
Wrapper side (htrflow_batch.logship)
- Capture.
LogCapture.install()replacessys.stdoutandsys.stderrwith tees. The tees write through to the originals, sokubectl logsis unchanged, and append to one in-memory buffer in arrival order. It is installed before logging is configured, so the rootStreamHandlerbinds the tee, and both htrflow'sloggingoutput and its bareprints land in the buffer. - Redaction. Every chunk is URL-redacted (userinfo and query removed) as
it arrives in the buffer. That covers a bare
print, and a handler a library installed itself, not only the wrapper's own log lines. - Shipping. Once the
ResultStoreexists,start_shipping(upload, LOG_SHIP_SECONDS)uploads straight away. A retried volume therefore replaces the previous attempt's log before the reader's first poll. A daemon thread then re-uploads the buffer every interval, when it has changed. An upload error is logged once and retried at the next interval, and never fails the run. The upload client has its own short timeouts (5 s connect, 15 s read, 2 attempts in all), so a dead bucket cannot pin the shipping thread. - The final upload.
finish()runs on every exit path: success, exit 13, exit 1, and the SIGTERM handler. It stops the thread, does a last upload and restores the streams, all inside a 90 s budget (FINAL_SHIP_SECONDS) that fits the pod's 120 s grace period. The final object is the complete log, not a tail. - A size cap. The buffer is capped at 4 MiB. Past that, the middle is dropped with a marker line, keeping the first 1 MiB and the last 2 MiB, cut on line boundaries. A pathological run cannot grow memory or upload size without bound.
- The key.
<namespace>/status/logs/<PIPELINE_ID>/<VOLUME_REF>.txt: under the release's namespace prefix (S3_PREFIX) like every other key, so two releases sharing a bucket keep their logs apart, but not under the volume prefix.LOG_SHIP_SECONDS=0disables periodic shipping, andfinishstill ships.
Limits. Only Python-level writes are teed. Anything writing to file
descriptors 1 and 2 directly, such as CUDA and C++ warnings or subprocesses,
shows only in kubectl logs. On a versioned bucket, each upload is a new
object version, about 240 an hour per running volume. Add a lifecycle rule,
or set LOG_SHIP_SECONDS=0.
Read API side
logUrl.GET /api/v1/jobs/{namespace}/{name}returns a deterministic, absolutelogUrl,<results-url>/<namespace>/status/logs/<pipeline>/<volume>.txt, for every volume row regardless of state. There is no existence check and nothing is cached. The URL is absolute because the API is the component that knows the results URL. The browser fetcheslogUrlthrough the results proxy, with its session cookie, and treats a 404 as "no log yet".- Retries. A retry does not retire or copy the key. The wrapper claims
the same key again at the start of the new attempt, so the new attempt's log
overwrites the previous one. The log is the complete evidence for the most
recent attempt. The read API's per-index
reason, the wrapper's own termination message, is the failure summary for as long as the failed pod exists. - Access. Run logs are read through the results proxy, so a person needs a login and an account the store lets read the namespace's prefix; the proxy serves nothing outside it (Security).
Browser side
The run viewer (/log) follows a running volume live
(Web front & read API). It reads the last terminal line
the wrapper wrote:
[<volume>] COMPLETE <n> pages, or a completemanifest.json: finished, and it stops.permanent failure in <stage>:, or a transient failure that sayson the last attemptand that no retry follows: failed, and it stops.- Any other
transient failure in <stage>:(a SIGTERMed attempt ends with one too): the attempt failed and a retry is pending, so it keeps polling and shows the retry's log when it starts.
It also stops after a run of failed polls, or when the proxy refuses the log (401 or 403).
Known limits
- A queued campaign does not say what it is waiting on. It could be quota, its warm-up, or a pause. A volume whose last page is long past is not marked as stalled either. Progress per volume is there, and this campaign half is not.
- Some failures surface as nothing. A campaign whose
volumes.txtConfigMap is missing shows an empty table and a "load more" that never loads. - Only a summary outlives the Job. A week after a campaign finishes —
ttlSecondsAfterFinished, which a pipeline may set for itself — the Job is reaped andcompletedIndexesandfailedIndexesgo with it. The status ConfigMap stays, so the read API still answers with the phase, the three counts, the timestamps and up to 50 failed volume ids with a sentence each; a 404 means no record was ever written, not that one expired. What is gone is per-volume detail beyond those 50, so "which volumes failed?" then costs one request per volume, againstmanifest.jsonandprogress.json. No campaign-level record is written to the bucket at all. - Read API edges. A detail request lists the campaign's running and
failed pods, a page at a time and trimmed to the fields it reads; a
succeeded pod is not read at all, since its index is already in
completedIndexes. For the few seconds between a volume's pod succeeding and the Job counting its index done, that volume can readpending. - An oversized
images:volume has no signal at all. Animages:volume whose URL list does not fit in one environment variable (Linux allows 128 KiB) kills the pod withArgument list too longbefore the wrapper starts.validaterefuses animages:line over 100 KiB, so only a campaign rendered before that check can hit it. - A warm-up that is running when its pod template changes waits for the next apply. A warm-up Job whose rendered pod template moved is deleted and created again, but not while it is downloading: that one is reported and left alone, and it is the operator who has to come back and apply again once it has finished (htrflow-campaigns CLI).